import numpy as np
import matplotlib.pyplot as plt
%matplotlib inline
%config InlineBackend.figure_format = 'retina'Simple Visualisation
ML
x = np.linspace(0, 10, 100)
y = np.sin(x)

plt.plot(x, y)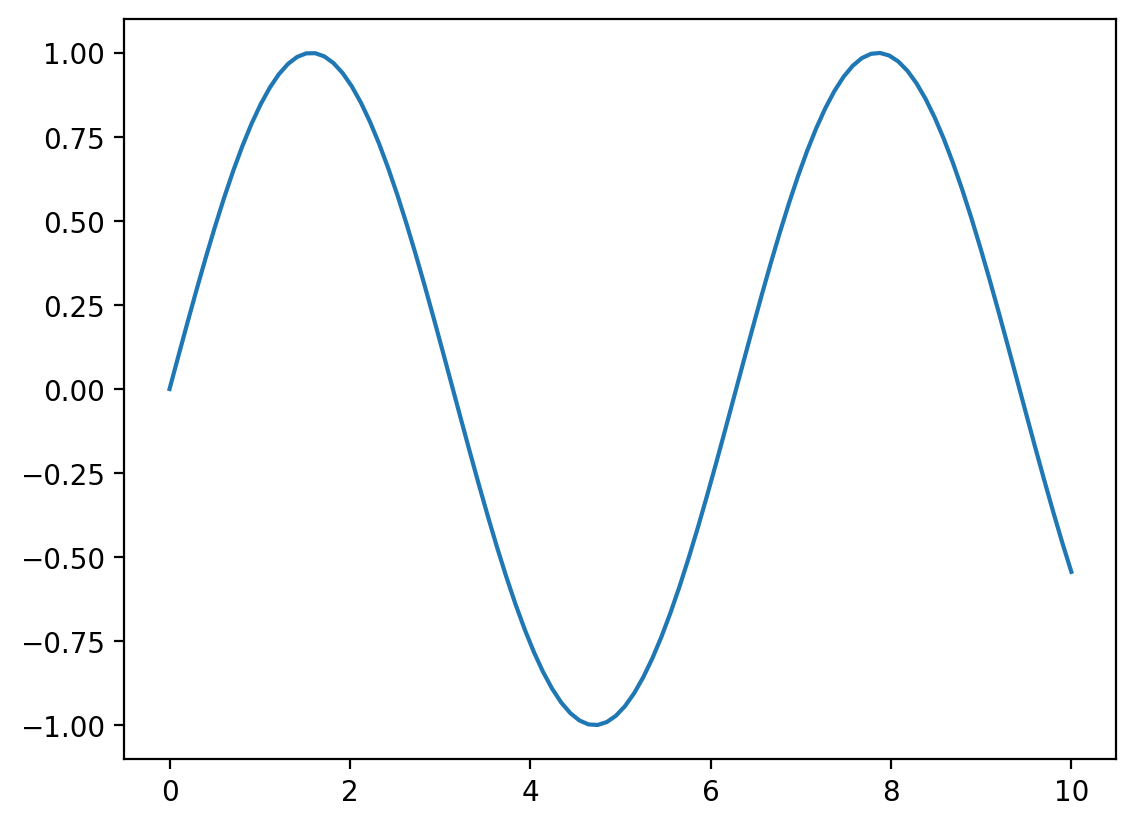
import numpy as np
import matplotlib.pyplot as plt
%matplotlib inline
%config InlineBackend.figure_format = 'retina'x = np.linspace(0, 10, 100)
y = np.sin(x)
plt.plot(x, y)